5 August 2021
Centuria Industrial REIT reports c.$1 billion of acquisitions in FY21
Growth complemented by c.$0.6 billion valuation uplift and c.240,000sqm of new leases
- 18 industrial acquisitions worth $966 million1, complemented by $587 million (25%) valuation uplift2
- c.240,000 sqm leased (22% of portfolio)3, 96.9% occupancy, 9.6 year WALE4
- Portfolio scaled to 67 assets worth $3.1 billion in FY22 YTD5, double FY20 YE value ($1.6 billion)
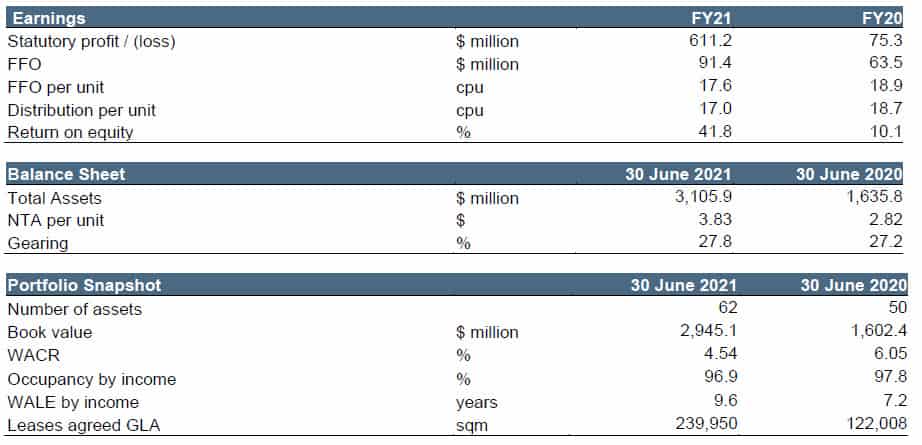
- 41.8% Return on Equity6, delivered on upgraded FY21 FFO guidance of 17.6 cents per unit7
- FY22 FFO guidance of 18.1cpu and distribution guidance of 17.3cpu8
Australia’s largest ASX-listed pure-play industrial fund, Centuria Industrial REIT (ASX:CIP), announced its Financial Year 2021 year end results revealing a record year for the REIT in terms of portfolio expansion and significant leasing activity resulting from strong industrial sector tailwinds, delivering significant value to its unitholders.
During FY21, CIP transacted 18 high quality acquisitions worth $966 million1. This included $631 million worth of assets across two new high conviction industrial sub-sectors, Data Centres and Cold Storage, as well as $335 million worth of urban infill logistics acquisitions.
Already in FY22, the REIT has further increased its portfolio from 629 to 6710 industrial properties, increasing its portfolio value from $2.9 billion6 to $3.1 billion5. Within 13 months, CIP has almost doubled its portfolio value from $1.6 billion as at 30 June 2020 to FY22 YTD.
The quality of CIP’s portfolio is illustrative with more than a half-billion-dollar valuation uplift ($587 million2) during FY21.
CIP’s portfolio Weighted Average Capitalisation Rate (WACR) compressed 151bps from 6.05% to 4.54% during FY21.
The strong valuation gain underpinned Net Tangible Assets (NTA) of $3.83 per unit9,11, a 36% increase during FY2112. This, combined with distributions of 17.0cpu7, delivered a Return on Equity of 41.8%6 to unitholders throughout the financial year.
Jesse Curtis, CIP Fund Manager, said, “FY21 was an extremely successful year for CIP, driven by transformative acquisitions and major portfolio leasing with income continuing to be supported by blue chip industrial tenant customers. Increased tenant demand and record low national vacancy rates, propelled by the continued rise of e-commerce, positively impacted the industrial property market.
“During FY21, Centuria delivered scale for CIP, boosting the portfolio with nearly $1 billion of high-quality industrial acquisitions. We made a high conviction call to enter two new industrial sub-sectors, with $633 million of investment in Data Centre’s and Cold Storage, sectors that will continue to benefit from significant growth. This was complemented with $335 million worth of urban infill logistics assets located with markets characterised by constrained supply.
“The strength of CIP’s performance is highlighted in its return on equity exceeding 40% during FY21. This strong performance is in partly credited to Centuria doubling CIP’s portfolio value in just over a year and major leasing achievements, which translates to high returns for our unitholders.”
FY21 was punctuated with by strong leasing transactions for CIP with nearly 240,000sqm of lease terms agreed3. A substantial 33 leasing transactions were completed, which accounted for more than a fifth (22%) of the portfolio’s gross lettable area (GLA). Major long term leasing transactions were undertaken with the likes of Woolworths and Visy.
As at 30 June 2021, occupancy was maintained at 96.9%4 and CIP’s Weighted Average Lease Expiry increased to 9.6 years4 from 7.2 years during the previous period.
CIP continued to deliver on its value-add projects with the completion of a brand new, prime-grade industrial development at 42 Hoepner Road, Bundamba QLD achieving Five-Star Green Star Design and As-Built status.
Curtis continued, “CIP has delivered exceptional leasing and value-add projects during FY21 through an active management approach and dedicated industrial team. We partnered with major tenants, such as Woolworths and Visy, to achieve these results, which create great outcomes for our tenant customers and unitholders, alike.”
During FY21, CIP was included in S&P/ASX 200 Index and most recently the FTSE EPRA Nareit Global Index, the latter means the REIT is more easily compared to high-performing peers across the world.
Curtis concluded, “The domestic industrial market has continued to strengthen with strong tailwinds from increased adoption of e-commerce as well as increased demand from tenants onshoring operations. Record low vacancy rates have been recorded across all major markets and Australia’s industrial real estate sector remains a highly sought-after market attracting investment demand and creating robust competition for quality industrial and logistics assets.
“With rising e-commerce, there’s a shift in consumer expectations for rapid delivery times and we believe that this global shift from shops to shed will continue. This creates strong demand from occupiers for urban infill logistics assets to help manufacture, fulfil or distribute orders quickly, and these markets are a focus for CIP where we see a greater propensity for rental growth.
“CIP’s focus centres on building critical mass in key urban infill markets and, through acquisitions, leasing and value-add projects, the REIT aims to deliver long-term sustainable income streams and capital growth to unitholders.”
CIP provides FY22 FFO guidance8 of no less than 18.1 cents per unit and distribution guidance8 of 17.3 cents per unit with distributions paid in equal quarterly instalments.
FY21 year end summary
1 Before transaction costs. Includes assets exchanged but not settled as at 30 June 2021. 95-105 South Gippsland Highway, Dandenong South development as is complete value.
2 Reflects gross increase. Excludes capital expenditure incurred
3 Includes Heads of Agreement (HoA).
4 By income
5 Includes 95-105 South Gippsland Highway, Dandenong South development as is complete value
6 Return on equity calculated as (closing NTA minus opening NTA plus distributions) divided by opening NTA
7 FY21 initial earnings guidance of 17.4 cents per unit was increase twice during FY21 to be no less than 17.6 cents per unit
8 Guidance remains subject to unforeseen circumstances and material changes in operating conditions
9 As at 30 June 2021
10 FY22 Year to Date (YTD)
11 NTA per unit is calculated as net assets less goodwill divided by number of units on issue.
12 Past performance is not a reliable indicator of future performance