You are now leaving Centuria Australia
and entering Centuria New Zealand.
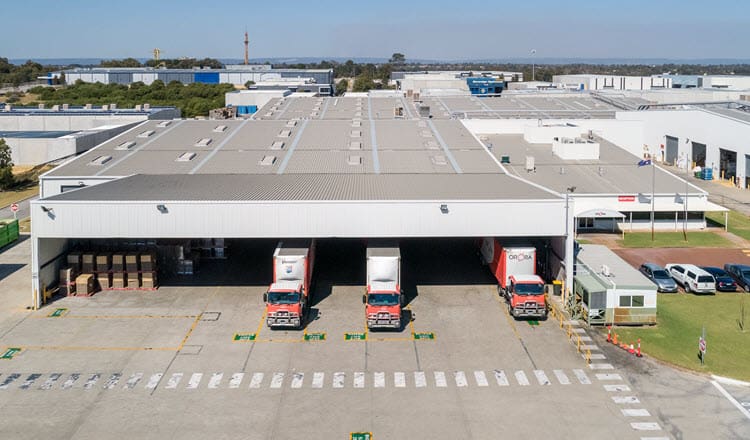
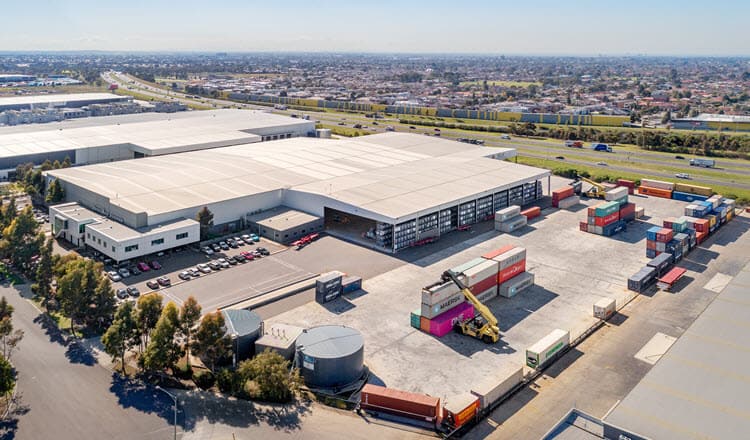
High quality assets
Portfolio book value
Portfolio occupancy
Portfolio WALE
(as at 31 December 2025)
| HY26 | FY25 | FY24 | FY23 | FY22 | FY21 | FY20 | |
|---|---|---|---|---|---|---|---|
| Number of assets | 85 | 87 | 89 | 89 | 88 | 62 | 50 |
| Book value ($m) | 3,931 | 3,890 | 3,834 | 3,839 | 4,101 | 2,945 | 1,602 |
| WACR (%) | 5,81 | 5.86 | 5.81 | 5.26 | 4.19 | 4.54 | 6.05 |
| GLA (sqm) | 1,274,867 | 1,293,790 | 1,325,318 | 1,289,129 | 1,330,182 | 1,083,814 | 945,611 |
| Average asset size (sqm) | 14,974 | 14,871 | 14,891 | 14,484 | 15,156 | 17,480 | 19,928 |
| Occupancy (% by income) | 95.7 | 95.1 | 97.1 | 98.0 | 98.8 | 96.9 | 97.8 |
| WALE (years by income) | 7.1 | 7.1 | 7.6 | 7.7 | 8.3 | 9.6 | 7.2 |