You are now leaving Centuria Australia
and entering Centuria New Zealand.
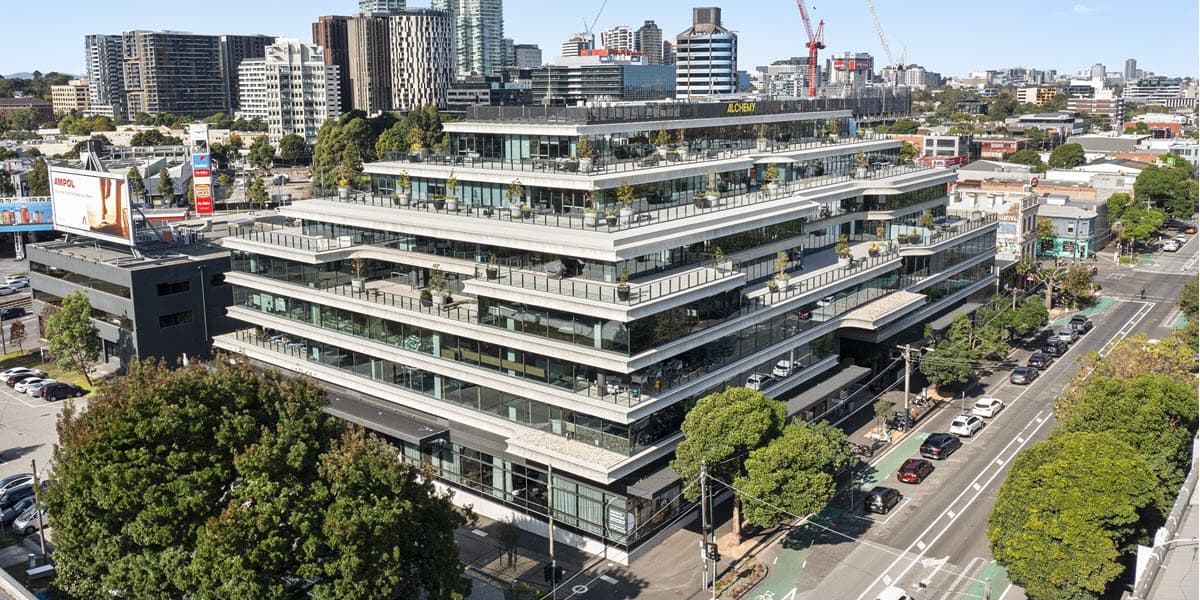
Australia’s largest listed pure-play office REIT.
During HY26, 29,354 sqm was leased across 26 transactions1, representing 10.7% of portfolio NLA. COF mitigated more than 71% of FY26 lease expiry risk during the period. Across the portfolio, 7,826 sqm of new leases were secured and 21,529 sqm renewed.
During the period, COF exchanged contracts to divest a non-core B-grade office asset at 9 Help Street, Chatswood NSW2 for $90 million, representing a 12.5% premium to book value. The asset had been held since COF’s IPO in 2014 and the prudent timing of the divestment reflects a 12.3% IRR and a 109% capital uplift.
Like-for-like portfolio revaluations reflected a $42.8 million increase3 or a 2.2% gain on June 2025 book values, marking the second consecutive period of growth.
Reaffirmed FY26 Funds From Operations (FFO)4 guidance of 11.1-11.5 cpu5 and FY26 distribution guidance of 10.1 cpu5.
HY26 FFO4 delivered
HY26 DPU delivered
NTA6
A-grade offices7
Belinda Cheung, Centuria Office REIT Fund Manager, discusses the Fund’s HY26 highlights.
Portfolio book value across 19 assets8
Portfolio occupancy9
Portfolio WALE10
NABERS SPI energy rating11
Providing high quality, highly connected and affordable office space.
 |  |  |  |
| Portfolio of young assets | COF exposed market rents average a significant discount to Sydney CBD | Access to wellbeing amenity, retail & hospitality | Connectivity with key transport nodes & reduced commute times |