You are now leaving Centuria Australia
and entering Centuria New Zealand.
A new investment charting feature awaits you in both adviser and investor access portals! Additionally, discover the enhanced holding balanced history reporting now available in our Investor portal.
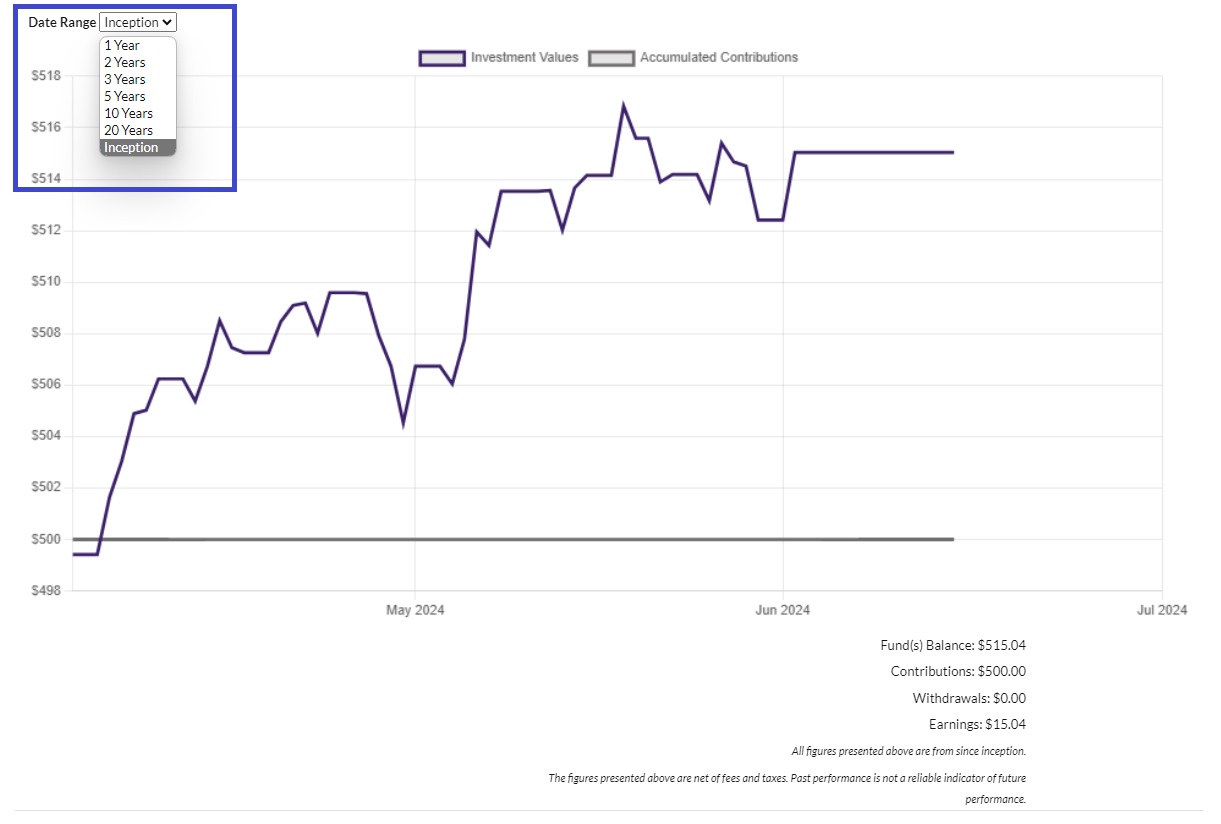
You can now access detailed investment performance charts for each bond portfolio your client holds. These charts display portfolio performance over time, with selectable ranges of 1, 2, 3, 5, 10, 20 years, and since inception. Each chart displays the portfolio balance, contributions and a summary since inception of withdrawals and earnings. For bonds held longer than 20 years, the chart will show performance since inception. You can also hover over the line(s) in the chart which will provide portfolio balance or contributions as at that date.
New investment chart:

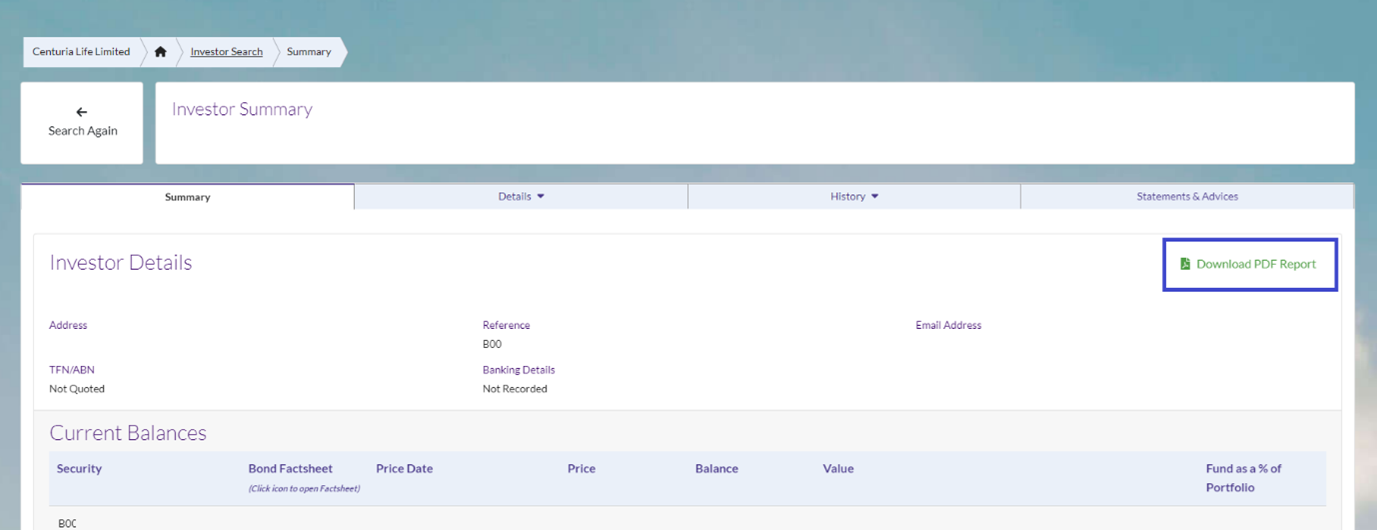
You can easily export these charts into PDF format for inclusion in a financial plan or annual update for your client.

Investment charting offers several benefits including:
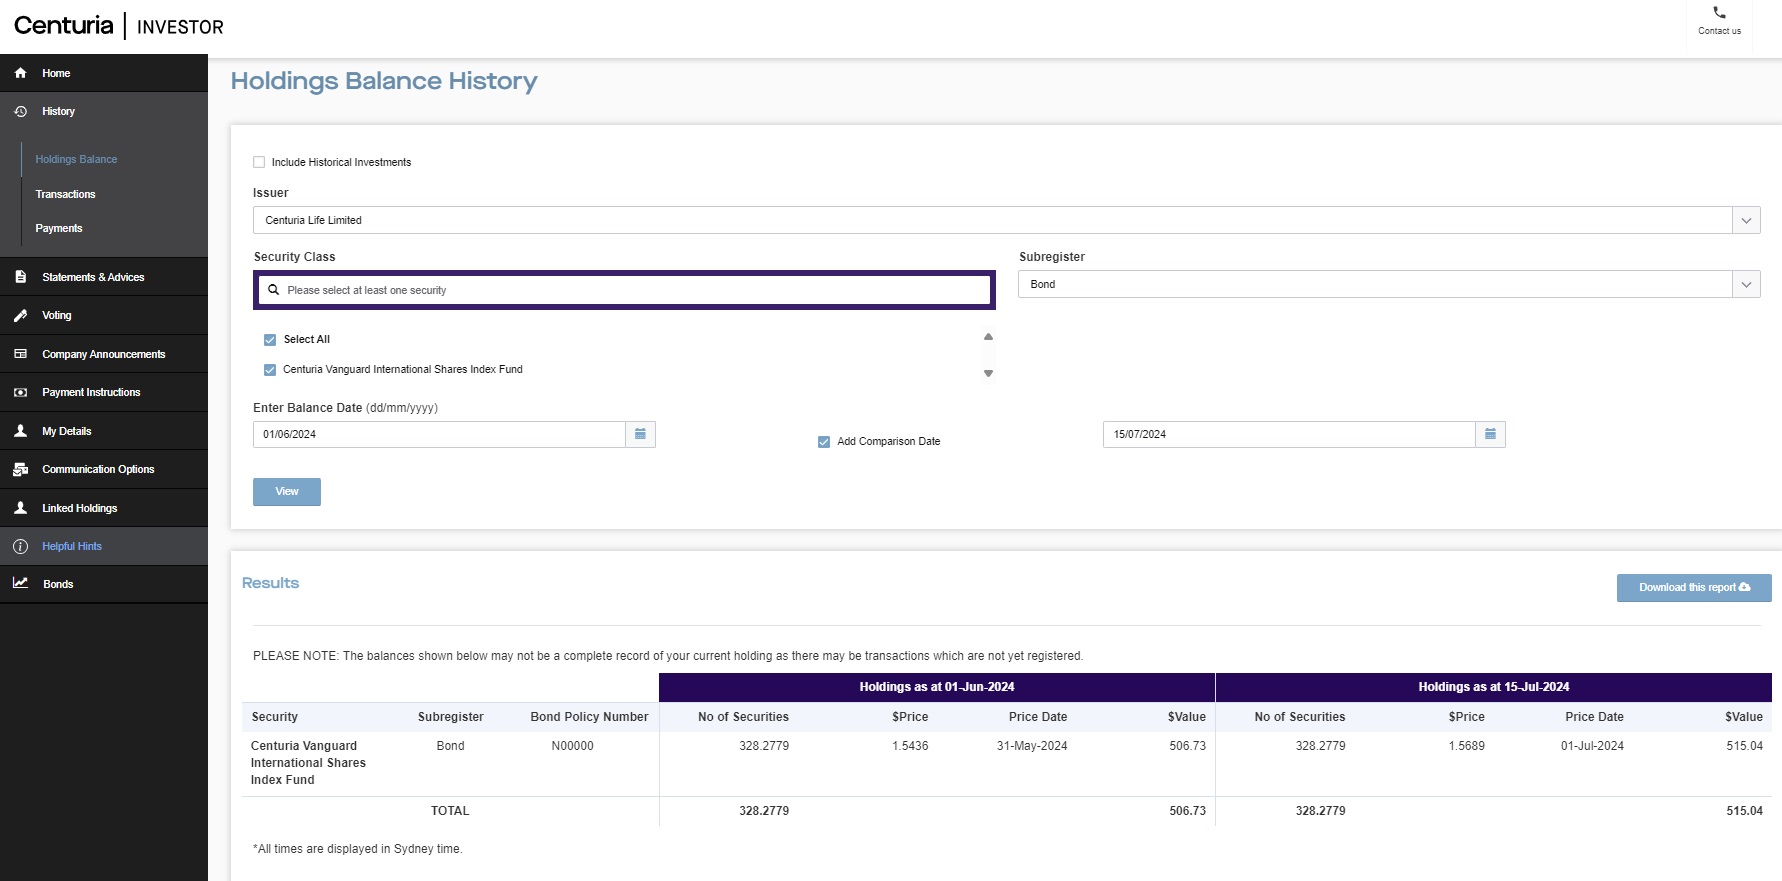
In Investor Access, your client now has improved holding balanced history reporting. This enhanced functionality allows your client to view the total fund balances for their entire portfolio at a glance, providing a comprehensive overview of your investment’s portfolio between two periods of time.
For added convenience, the enhanced reporting supports exporting data to Excel and PDF formats which will allow easily access and review of total fund balances, providing a clear picture of your client’s investment portfolio.
New holding balance history reporting:
