You are now leaving Centuria Australia
and entering Centuria New Zealand.


The commercial property market, like any financial market, goes through a repetitive pattern of ups and downs known as a market cycle. Understanding how market cycles work can help investors make informed decisions and stay committed to their long-term investment goals regardless of short-term fluctuations.
Download the guide
A market cycle refers to the period of time it takes for prices in a particular market to move through a series of recognisable phases before reaching a new high. It typically consists of four main phases:
This phase is characterised by strong economic growth, rising prices and high investor confidence, however, this can lead to assets becoming overvalued as prices reach the top of the market.
During this phase, market dynamics begin to shift resulting in weaker demand and softening prices.
Characterised by falling asset prices, low investor confidence and, in some cases, widespread fear, it is during this phase that prices reach their lowest point during the cycle. However, as assets become undervalued, it may present opportunities for investors to enter the market at attractive prices.
In this phase economic conditions begin to improve, helping stabilise prices and lift investor confidence.
As the term suggests, market cycles happen over and over again but no two cycles ever look the same. The length of a full market cycle and the duration of each phase can vary significantly depending on the various economic and market-specific factors at play in a market at any one point in time. These factors include macroeconomic conditions, geopolitical events, investor sentiment and unforeseen events, such as natural disasters or global pandemics.
It’s also worth noting that while all market cycles follow a similar up/down pattern, there are distinct differences between markets. For example, share market cycles tend to be shorter and more volatile while commercial property cycles are typically longer and more gradual in their movements.
A simple way for unlisted property fund investors to understand the commercial property market cycle is by using a popular concept known as the property clock. This concept represents the cycle as a clock face, with 12 o’clock signifying the top of the market, 6 o’clock signifying the bottom and the four, 15-minute increments representing the four main phases of the cycle.

To illustrate how the property clock works, let’s look at the office and industrial sectors of the Australian commercial property market at the end of the 2023 calendar year. Although both sectors were exposed to rising interest rates, prices in the industrial sector were more buoyant than those in the office sector, which continued to be weighed down by sector-specific factors such as higher vacancy rates and lower demand due to changing working patterns. On the property clock, this would show each sector pointing to a different time on the clock face.
This highlights that different sectors of the commercial property market can be in completely different phases of a cycle at the same point in time. In fact, even different segments of a sector, such as the office sector in Queensland and Melbourne, can be in different phases of the market cycle at the same time depending on location-based factors. These differences make it clear that thinking of the commercial property market cycle as a catch-all generalisation is not helpful.
Although the property clock makes it easy to visualise property market cycles and put current market conditions into context, it’s important to remember it is a simplification of very complex market settings. For this reason, the property clock should only be used as a general guide rather than the basis of making investment decisions.
Unlisted property fund investors who use their understanding of market cycles to decide when to invest or redeem can benefit in the short term if they manage to get the timing right. However, investors should also be aware that this ‘market timing’ approach can come with several disadvantages and risks.
Rather than trying to time the market by jumping in and out based on market fluctuations, investors should consider whether they are better off staying invested over the long- term and riding out market cycles. This investment approach is known as ‘time in the market’.
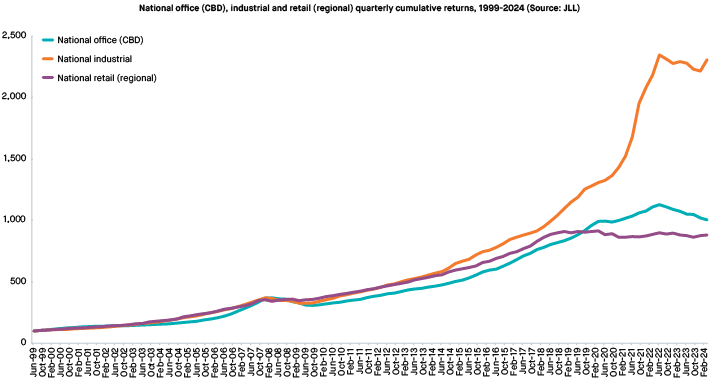
Returns from commercial property1 have followed an upward trend over the long- term as shown in the chart below, which shows the growth of $100 invested in each of the Australian office, industrial and retail sectors over the past 25 years. Despite experiencing occasional, and inevitable, slumps or slowdowns whilst moving through various cycles, the market has continued to climb steadily higher over time.
Staying invested over the long term and riding out market cycles can allow unlisted property fund investors to benefit from the market’s steady capital appreciation over time whilst avoiding the stress and anxiety that can come with trying to predict market movements.
By maintaining a disciplined, long-term investment approach based on sound fundamentals, investors are more likely to navigate market cycles effectively, minimise risk and build their wealth over time.
1. Returns based on underlying real asset returns and do not show the impact of leverage, which can have both positive and negative impacts on returns.
Disclaimer: Issued by Centuria Property Funds Limited ABN 11 086 553 63911 AFSL 231149 (Centuria). This information is general information only and does not take into account the objectives, financial situation or particular needs of any person. You should consider whether this information is appropriate for you and consult your financial or other professional adviser before investing. All investments in unlisted property funds carry risk. It is important that you read the Product Disclosure Statement and Target Market Determinations available for each Fund and understand the risks of investing before making any decisions. Target market determinations (TMDs) for Centuria’s Funds are available on our website at centuria.com.au/ddo.
Please complete the form to register your interest in receiving updates on future unlisted property fund opportunities.