
You are now leaving Centuria Australia
and entering Centuria New Zealand.

$20.2bn1 Australasian portfolio delivers upgraded OEPS guidance
Leading Australian real estate funds manager, Centuria Capital Group (ASX:CNI or ‘Centuria’), today credited organic growth across its real estate acquisitions, revaluations and development pipeline for delivering strong 2022 Financial Year interim results.
During the period, Centuria benefitted from $2.5 billion3 of gross real estate acquisition in HY22, split by $1.6 billion of unlisted and $0.9 billion listed real estate. In addition, the quality of its existing portfolio was highlighted by a $600 million valuation uplift.
Significantly, Centuria’s development pipeline grew to $2.2 billion4 and continues to provide committed and future opportunities for the Group’s listed and unlisted real estate funds, delivering sustainable, modern assets.
Centuria’s platform expanded to $20.2 billion1, of which $19.3 billion is invested in a diversified real estate portfolio, which increased 17% during HY22. Its unlisted real estate funds increased 15% to $12.6 billion, and its ASX and NZX-listed REITs grew 22% to $6.7 billion.
Jason Huljich, Centuria Joint CEO, said, “HY22’s performance is a clear example of utilising our in-house management expertise across Australasia and servicing our expanded investor distribution network to execute on several funds management initiatives. In the past twelve months we have doubled2 our assets under management to $20.2 billion from $10.2 billion at HY21.
“In fact, Centuria’s growth for the half exceeded what was our entire platform value around five years ago7, illustrating the strength of the Group’s growth trajectory in a relatively short period.”
The Group’s consistent growth is demonstrated with a 45% compound annual growth rate (CAGR)8. Additionally, a 12-month Total Shareholder Return (TSR)9 of 37.9% was achieved, outperforming the S&P ASX200 A-REIT Index returns of 26.1% and the S&P ASX200 Index returns of 17.2%.
Centuria specialises in seven asset classes across Australia and New Zealand, including decentralised office, industrial, healthcare, daily needs and large format retail, agriculture and real estate finance.
John McBain, Centuria Joint CEO, added “This is Centuria’s first reporting period as an ASX-200 listed entity and we are pleased to deliver such strong results for our securityholders. The Group’s momentum is credited to significant organic growth as a result of strategic corporate mergers we executed in previous reporting periods, which provided access to new markets, broader distribution lists and new asset classes.
“During the period, Centuria’s unlisted retail investors have continued to invest strongly and we have been active in placing new assets with our institutional mandate partners, making HY22 a very successful period.
“Our enlarged platform and corresponding strong performance enabled us to upgrade our operating earnings guidance and reiterate our distribution guidance, which is a resounding achievement despite the backdrop of the ongoing COVID-19 impacts. The ability to upgrade our earnings guidance also shows our confidence in the future potential for the Group to maintain its growth momentum.”
Centuria upgraded its FY22 Operating Earnings Per Security (OEPS) guidance to 14.5 cents per security (cps)6, representing a 9.85% increase on its initial FY22 guidance of 13.2cps and a 20.8% increase above FY21 OEPS of 12.0cps. It reaffirmed its FY22 distribution guidance of 11.0cps.
The Group’s total operating revenues rose to $139.4 million (+26% from HY21) and Operating Profit After Tax rose to $58.7 million10 (+73% from HY21). Operating recurring revenues of 87% remained in line as a percentage of total revenues (HY21:88%).
Management fees of $64.7 million bolstered recurring revenues. Transaction fee income of $24.4 million was up 400% on HY21, resulting from $3.5 billion5 of total transaction activity. During the period, $4.7 million of cash was collected from $19.1 million of recognised performance fees. Latent underlying performance fees of $24.8 million were recorded across Centuria’s unlisted real estate funds.
Centuria retained a strong balance sheet as at HY22 with $241 million of cash and undrawn debt on hand, an operating gearing ratio11 of 8.3% and strong operating interest cover ratio of 9.4 times. Balance sheet flexibility broadened with the addition of a $100 million three-year revolver facility. Net asset value (NAV12) per security increased to $2.00 (HY21: $1.92). Centuria continues to use its balance sheet to support growth initiatives across its funds management platform.
| Earnings | HY22 | FY21 | |
|---|---|---|---|
| Operating NPAT10 | $m | 58.7 | 34.0 |
| Operating EPS6 “OEPS” | cps | 7.4 | 6.2 |
| Statutory NPAT13 | $m | 112.7 | 42.7 |
| Statutory EPS13 | cps | 13.8 | 7.5 |
| Distribution per stapled security “DPS” | cps | 5.5 | 4.5 |
Entities Centuria has consolidated into its business all provided contributing profit and growth across the Group platform (see graph below).
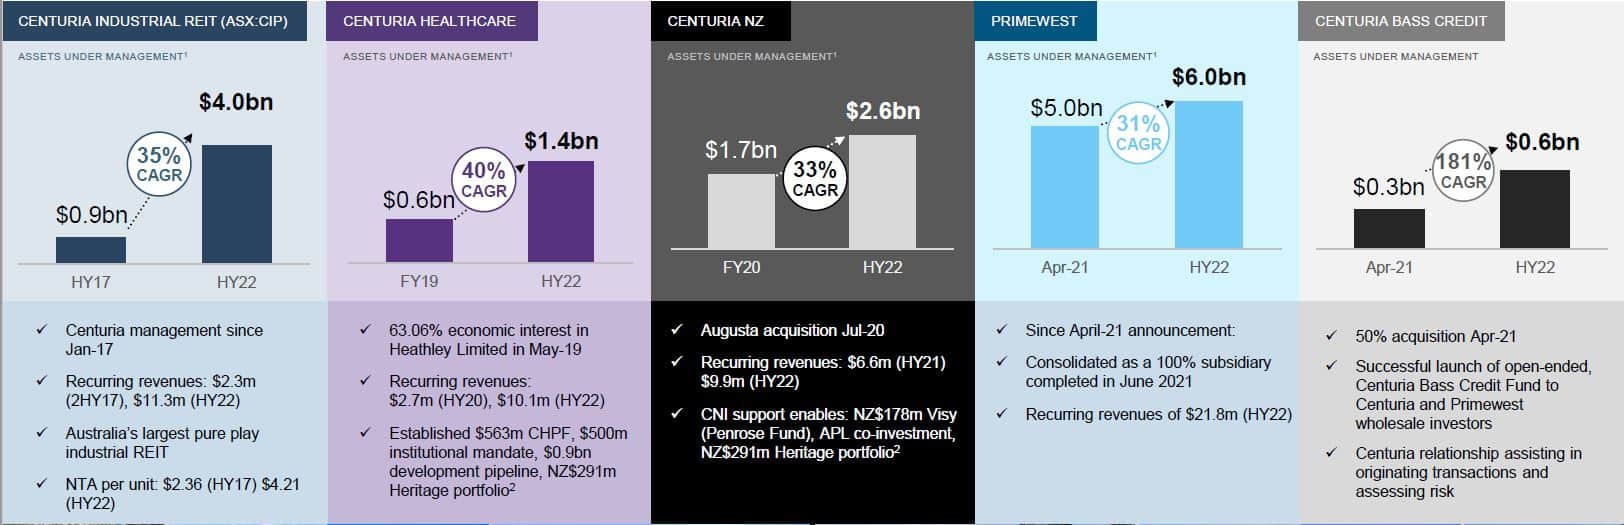
* Assets Under Management includes exchanged to be settled, cash and other assets
** The Heritage portfolio was acquired by Centuria Healthcare Property Fund and the new Centuria New Zealand Healthcare Property Fund
1. Includes assets exchanged to be settled, cash and other assets
2. Group AUM increased 49.5% between HY21 and HY22
3. Includes $1,060m of acquisitions exchanged and settled in HY22, $1,087m of new acquisitions exchanged in HY22 yet to be settled and $328m of real estate debt transactions
4. Development projects and development capex pipeline, including fund throughs
5. Includes $735m of acquisitions exchanged at FY21 results that have since settled, $1,060m of acquisitions exchanged and settled in HY22, $1,087m of new acquisitions exchanged in HY22 yet to be settled, $328m of real estate debt transactions and $257m of divestments
6. Operating EPS is calculated based on the Operating NPAT of the Group divided by the weighted average number of securities. Guidance remains subject to unforeseen circumstances and material changes in operating conditions.
7. FUM as at 30 June 2016 was $1.9 billion. During the period, Centuria transacted more than $2.5 billion.
8. CAGR is calculated from 30 June 2017 to 31 December 2021
9. Source: Moelis Australia. Based on movement in security price from ASX closing on 31 December 2020 to ASX closing on 31 December 2021 plus distributions per security paid during the respective period(s) assuming re-investment of all distributions. Past performance is not a reliable indicator of future performance
10. Operating NPAT of the Group comprises of the results of all operating segments and excludes non-operating items such as transaction costs, mark to market movements on property and derivative financial instruments, the results of Benefit Funds, Controlled Property Funds and share of equity accounted net profit in excess of distributions received
11. Gearing ratio is calculated based on (operating borrowings less cash) divided by (operating total assets less cash)
12. Number of securities on issue 31 December 2021: 790,170,111 (at 30 June 2021: 787,802,693)
13. Attributable to securityholders