Email Phone Next Scroll to move Touch to move edit Play Play Pause Volume Mute Zoom Open Close Search Linked In Linked In X Facebook Instagram Close
Icons_Buildings-1
$21.0bn

Group AUM1

Icons_Target-12
14.5cps

FY23 OEPS2 delivered

Icons_Money-spiral
11.6cps

FY23 DPS delivered

Icons_12months
91%

Recurring revenue

Centuria Capital Group - FY23 annual results

A leading Australasian ASX 200 funds manager

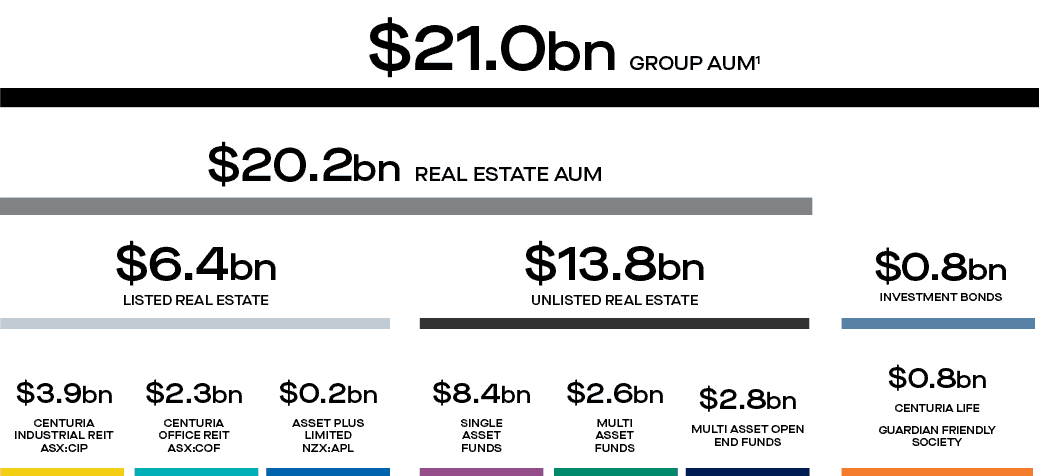
Throughout FY23, Centuria Capital Group (ASX:CNI) grew its funds management platform to $21 billion1 of AUM and continued to focus on differentiating its traditional office, industrial and retail platforms, while markedly expanding across the alternative sectors of real estate finance, healthcare and agriculture.

Centuria met its operating earnings per security (OEPS) guidance of 14.5cps2 and distribution per security (DPS) guidance of 11.6cps (+5.5% above FY22 DPS).

The Group maintains a healthy balance sheet with the capacity to fund organic growth.
Results highlights


Icons_Buildings-1
$1.4bn

FY23 gross real estate activity3

Icons_building-construction-crane
$1.6bn

development pipeline4

Icons_Star
Ongoing ESG

reporting

Centuria Capital Group (ASX:CNI) AUM

CNI Group AUM


1. Assets under management (AUM) as at 30 June 2023. All figures above are in Australian dollars (currency exchange ratio of AU$1.000:NZ$1.0883 as at 30 June 2023). Numbers presented may not add up precisely to the totals provided due to rounding. AUM includes assets exchanged to be settled, cash and other assets and the impact of net revaluations during the period.
2. Operating EPS (OEPS) is calculated based on the Operating NPAT of the Group divided by the weighted average number of securities​.
3.  Includes $811m of acquisitions exchanged and settled in FY23 and $542m of real estate finance transactions​.

4. Development projects and development capex pipeline, including fund throughs. Estimated gross value on completion committed development pipeline $0.8bn, future pipeline $0.8bn.​