CIP Property CompendiumCIP FY22 Financial ReportCIP FY22 Appendix 4E
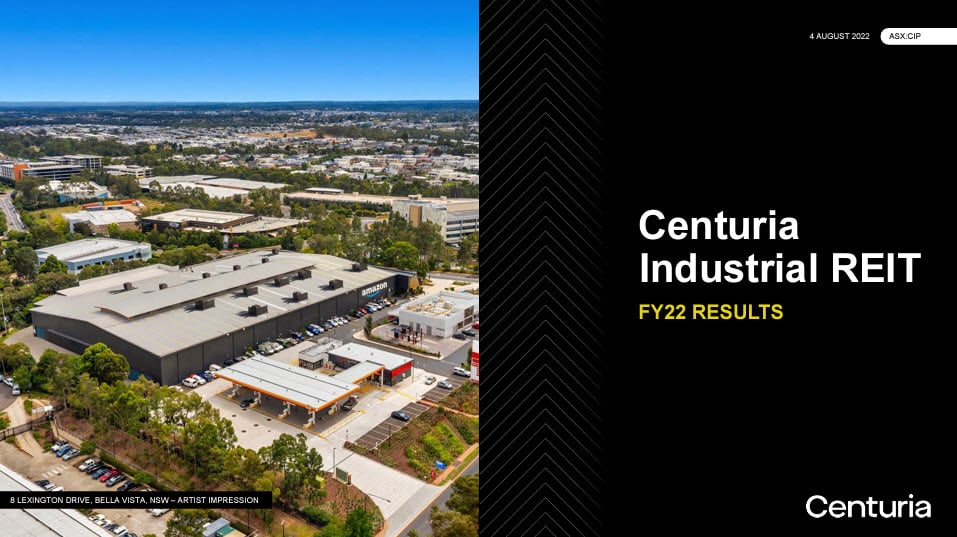
Centuria Industrial REIT
FY22 Annual Results
Australia’s largest domestic pure play industrial REIT
Centuria Industrial REIT (ASX:CIP) has announced FY22 results to 30 June 2022.
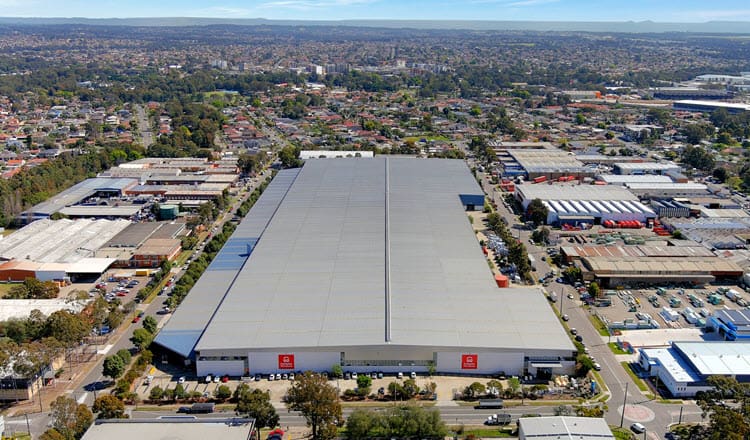
Centuria Capital is the manager of Centuria Industrial REIT (ASX:CIP). CIP has grown to be Australia’s largest domestic pure play industrial REIT with a portfolio of 88 high quality industrial assets worth $4.1bn, located in key urban infill markets across Australia. CIP is overseen by a hands-on, active manager and provides investors with income and an opportunity for capital growth from a portfolio of high quality industrial assets.
Centuria Industrial REIT (ASX:CIP) is included in the S&P/ASX200 Index & FTSE EPRA Nareit Global Developed Index.